Drawing a better bandwidth graph for Netlify
I currently host this site on Netlify’s Starter plan, which means I can serve 100GB of bandwidth per month. That’s usually plenty, and I’ve only exceeded it a few times – this site is mostly text, and I only have a modest audience.
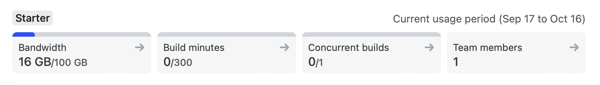
I can see how much bandwidth I’ve used in the Netlify dashboard:
Because this graph is only available in the Netlify dashboard, I don’t see it very often. I log into this dashboard very rarely, because all of my day-to-day activity is automated using GitHub Actions.
Even if I did log into the dashboard, I don’t like this graph – my billing periods start on the 17th of the month, and it’s hard to make a quick assessment of how likely I am to exceed my bandwidth allowance for the month. If I’ve used 16GB on the last day of the month, I’m fine. If I’ve used 16GB on the first day of the month, I’m going to have issues.
I want to know if I’m using too much bandwidth, because there might be changes I can make to reduce how much bandwidth I’m using. For example, if a post has gone viral, I might be able to make the images in that post smaller.
Fortunately my Netlify bandwidth data is exposed through an API, so I was able to build my own version of this graph. My new graph makes it easier for me to see if I’m likely to exceed my bandwidth allowance, and it lives in my analytics dashboard where I’m more likely to see it.
Getting my bandwidth data
Netlify exposes your bandwidth data through an undocumented API endpoint. There are three steps to use this API:
Create a personal access token in your user settings.
Get your team account slug. You can find this in the Netlify dashboard under
Team settings>General>Team details>Team information.Call the Netlify API to get the data. You should get a 200 OK and a JSON response:
$ curl \
    --header "Authorization: Bearer $NETLIFY_TOKEN" \
    "https://api.netlify.com/api/v1/accounts/$TEAM_ACCOUNT_SLUG/bandwidth"
{
  "used":                                 17783181573,
  "included":                            107374182400,
  "additional":                                     0,
  "last_updated_at":   "2024-09-21T04:57:41.130+00:00",
  "period_start_date": "2024-09-17T00:00:00.000-07:00",
  "period_end_date":   "2024-10-17T00:00:00.000-07:00"
}
The I’ve never seen The bandwidth data isn’t updated in real time; as best I can tell it’s every few minutes. The API response includes a I wanted a chart that would show me how much of my bandwidth I’d used, and how much of the billing period had passed. I could do this with a pair of bars next to each other, but I prefer circular pie charts for this sort of data – I find it easier for me to judge the proportions. Is it a quarter filled, a third, a half, and so on. I decided to draw the data as a two-part pie chart. There’d be an inner wedge which shows how much of my bandwidth I’ve used, and an outer arc which shows how much of the month has passed. If the wedge is smaller than the arc, everything’s fine – I’m on track to use less bandwidth than my allowance for the month. If the wedge is larger than the arc, I need to keep an eye on things, in case I use all my bandwidth. Let’s look at a few examples, which will make this clearer. This is my current usage – I’m using bandwidth slightly faster than the billing period is passing, but not by much. I need to keep an eye on this as the month passes. Here I'm only just halfway through the month, but I’ve used nearly all my allowance – I need to slow down, and maybe buy an extra bandwidth pack. Fortunately, this is rare. I’m three-quarters through the month, but I’ve only used about half my bandwidth allowance. This is pretty normal, and I don't need to make any changes. These charts aren’t meant to convey detailed information; just a quick glance to help me decide whether I need to do something. I have them embedded in my analytics dashboard, which I check at least once a week. Several years ago I wrote notes on drawing circular arcs in SVG, which were useful when drawing these graphs. This particular implementation is JavaScript, and if you want to read the code in more detail, I’ve created a little demo page.used value is how many bytes you’ve used, and included is how many bytes are available in your plan. Note that Netlify’s limits are in gibibytes, not gigabytes – so although their marketing page says “100 GB”, it’s actually 100 GiB, or 100 × 230 bytes. additional be anything other than 0 – I suspect you’d see something there if you buy additional bandwidth packs, but at $55/100GB that’s always been too pricey for me. (If I ever exceed my 100GB allowance, I pay $19 for a month of a Pro subscription which gets me 1TB bandwidth – saving nearly $500. I’ve never exceeded 1TB of bandwidth in a month.)Retry-After header to help you avoid wasting time on unnecessary requests.Drawing this as a pie chart