Getting helpful CloudWatch alarms in Slack
I wrote this article while I was working at Wellcome Collection. It was originally published on their Stacks blog under a CC BY 4.0 license, and is reposted here in accordance with that license.
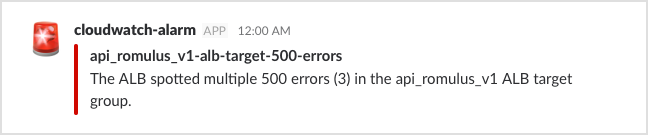
In the digital platform team, we make heavy use of Slack for our monitoring. As soon as something goes wrong, we get a message telling us about the problem. Here’s an example:

Real-time messages in Slack let us react quickly to errors. In this post, I’ll explain how these alarms work, and some work we’ve done to make them as helpful as possible.
Architecture

All our logging and monitoring is handled by CloudWatch. We have CloudWatch metrics that measure the state of our deployment — for example, the number of messages on each queue, or the 500 errors returned from our applications.
For important metrics, we create CloudWatch alarms that trigger whenever a metric crosses a defined threshold — for example, when a dead-letter queue has a non-zero number of messages. When an alarm triggers, we have CloudWatch send a notification to an SNS topic.
All our alarms send notifications to the same topic, which in turn triggers a Post to Slack Lambda. This is a Python function that reads the notification, and calls the Slack API to post a message to an internal Slack channel.
Creating richer alarms
The SNS notification includes the alarm name and the state reason (why was the threshold crossed). We can expose those for a basic alarm, but it’s not always obvious what the alarm means:
We’ve made a number of changes to our Post to Slack Lambda to improve on the basic alarm, so we get more context and more helpful messages in Slack.
Threshold Crossed: 1 sentence was less than clear
The state reason explains why the alarm was triggered, for example:
id_minter-alb-unhealthy-hosts
Threshold Crossed: 1 datapoint [3.0 (05/02/18 14:34:00)] was greater than or equal to the threshold (1.0).
This message is describing the internals of CloudWatch — but what does it actually mean? It only makes sense if you know what the underlying CloudWatch metric is measuring.
Because the state reason follows a standard pattern, we can parse it to get the useful information, and then try to replace it with something more human-friendly. Some examples:
There are 2 unhealthy targets in the transformer ALB target group.
There was an error in the notify_old_deploys Lambda.
There are 2 items on the sierra_items_windows DLQ.
There were multiple 500 errors (4) from the grafana ALB target group.
These messages are shorter, so they’re more likely to be read, and they give more context than the default message.
The logic that picks these sentences relies on our alarm names following a consistent naming scheme — for example, every DLQ metric is named queue_name_dlq_not_empty. We manage our entire deployment using Terraform, and this consistency is a nice side benefit.
Not all alarms are equally severe
Some alarms need a faster response than others. The public-facing API is down? Let’s fix that immediately. An assertion in an internal service? We’ll fix that too, but it doesn’t have to be right now.
To make our urgent alarms stand out, we have two levels of message: “error” and “warning”. Our Lambda decides a level for each alarm, and formats it accordingly. These are examples of the two formats:
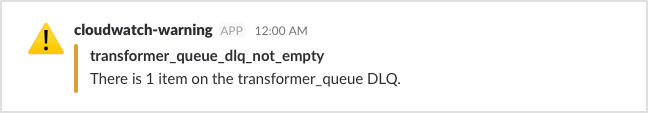
So if we’re having a bad day, we can easily pick out the most important alarms.
Additionally, we have two channels: our main team channel gets any critical errors for public-facing services, and a side channel gets warnings for everything else. We have to be disciplined about checking the side channel, but we’ve found this is a good way to reduce noise in our main channel, and it makes important errors stand out even more.
Links to CloudWatch logs
These alarms are good, but they’re a bit passive. There’s no call to action. Once an alarm fires, what should we do next? A common starting point is to check the logs — and we can help there too.
When an application has an error, there are key phrases that we know to look for. In a Python Lambda, errors are usually accompanied by “Traceback” or “Task timed out”. In our Scala services, “HTTP 500” is a good phrase to search for.
We can work out the CloudWatch log group name from the alarm name (because they both follow consistent naming conventions, thanks to Terraform). We know roughly when the error occured from the alarm message, and together with the search terms we can build a link to the CloudWatch web console.
For example, here’s a link that searches for “HTTP 500” in the “platform/api_romulus_v1” log group at around noon:
So if we know some search terms to try, our Lambda includes a link to some hopefully useful logs:

To reduce visual noise, we use bit.ly to shorten the links.
So now our alarm has a call to action: an error occurred, now click here to read the logs.
Inline CloudWatch logs
When you look at the CloudWatch web console, it’s using the FilterCloudWatchEvents API under the hood to find matching log events. Why not do that in our Lambda?
So as well as posting the URL, our Lambda does a quick search of the logs, and includes anything that looks interesting in the Slack alarm. This isn’t perfect — if there’s a lot of logging, it may give up before it finds the relevant line — but when it works, it can be really helpful. Here’s another example:
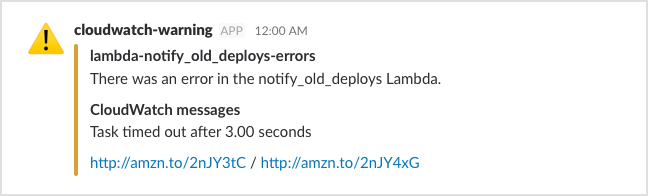
So now we get an alarm, we see which application went wrong, and we can see the cause of the bug without even leaving Slack. (This Lambda makes several network calls, and we’ve just been unlucky and hit the default timeout. The fix is to raise the timeout, which I did as soon as I left Slack.)
Try it yourself!
These alarms aren’t a fixed target — we’re often tweaking them to make them more useful. There’s no “right” way to format these alarms, but there are ways to make them more helpful.
All the code that builds these alarms is on GitHub, and MIT-licensed. The main Lambda code is in post_to_slack.py, and some Platform logic lives in separate files.
Some of this is specific to our deployment, but the ideas could apply to any setup. If you use Slack for monitoring, I’d encourage you to think about humanising your alarms. We’ve found it makes them significantly more helpful, and that means errors get fixed that much quicker!