Drawing with triangular coordinates in SVG
If you’ve been paying close attention to my recent posts, you might have noticed that I’ve started to use SVG images for some of my diagrams. I like SVGs because they tend to be sharper and smaller than bitmap images, and I can generate them programatically (rather than drawing them in a GUI app).
One of the things I’ve been playing with is alternative coordinate systems – in particular, drawing images that fit on a triangular grid. This feels like it might be useful in lots of places, so in this post I’m going to walk through how it works. It’s easier if you remember some trigonometry from school, but if not I’ll explain it was we go along.
Choosing a coordinate system
A coordinate system is a way to represent the location of some points – for example, places on a map, or the corners of a shape. We can define a shape by its coordinates, and then an SVG renderer can use those coordinates to draw the shape.
The coordinate system most people are familiar with is Cartesian coordinates, or $(x,y)$-coordinates. There’s a vertical and a horizontal axis, and the $(x,y)$-coordinates of a point are measured by how far you have to move along the axis to get to the point.
SVG flips this on its head (literally), because the $y$-axis moves down rather than up, but otherwise the principle is the same. Here’s what it looks like:
For example, the coordinates in this SVG define a black square:
<!-- square.svg -->
<svg viewBox="0 0 30 30" xmlns="http://www.w3.org/2000/svg">
  <polygon points="10,10 20,10 20,20 10,20" fill="black" />
</svg>
Here’s what that image looks like (the grey dashed line marks the edge of the SVG):
This sort of coordinate system is great if you’re drawing rectangular shapes, but for other types of diagram it’s not so easy. Let’s suppose, for example, that we wanted to draw this hexagonal grid as an SVG:
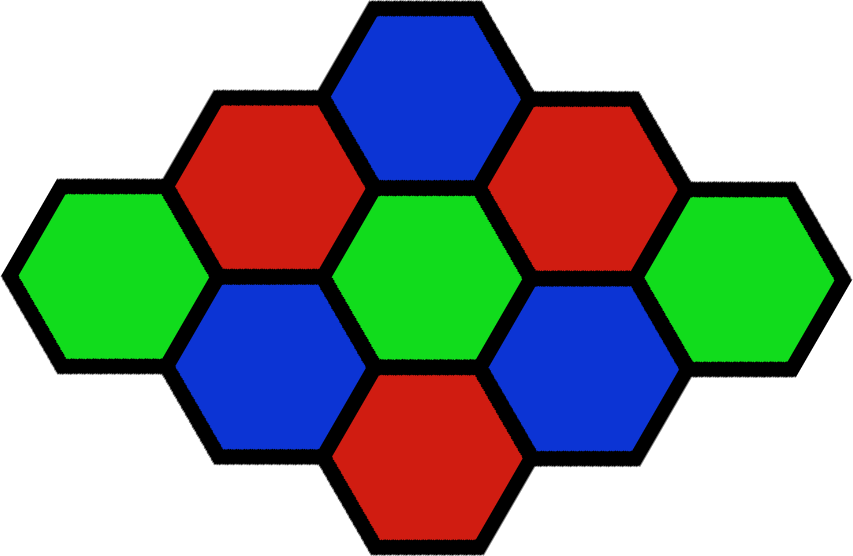
We could try to define it with Cartesian coordinates, and do a bunch of moderately fiddly trigonometry for each of the points. But it’s much easier to define if you’re working on a triangular grid – every point neatly snaps to one of the points on the grid.
Here’s a definition for triangular coordinates: we define $\langle 1, 0 \rangle$ to be a step of $1$ unit to the right, and $\langle 0, 1 \rangle$ to be a step of $1$ unit at a $60^\circ$ angle. I’m using the $\langle \cdots \rangle$ brackets to distinguish between triangular and $(x,y)$-coordinates.
The choice of a $60^\circ$ angle means the grid divides into equilateral triangles (equal sides, equal angles). This is a convenient choice for lots of diagrams, but the process below would work for any choice of angle.
Writing out the points of a regular hexagon in this coordinate system is much simpler than doing so in Cartesian coordinates. Rather than mucking around with any trig, we get neat integer points:
So now we have a coordinate system that lets us define triangular shapes – but we can’t use it in an SVG image. SVG renderers only know how to draw shapes in Cartesian coordinates, so we need to map our triangular coordinates to Cartesian ones. Let’s tackle that next.
Mapping between coordinate systems
We want a function that takes a point $\langle a, b \rangle$ in triangular coordinates and returns the corresponding $(x,y)$ in Cartesian coordinates. If we can work out what $\langle 1, 0 \rangle$ and $\langle 0, 1 \rangle$ in triangular coordinates become in Cartesian coordinates, that’s enough – we can then add those together to get the coordinates for $\langle a, b \rangle$.
The first is simple: $\langle 1, 0 \rangle$ is the same in both triangular and Cartesian coordinates.
What about $\langle 0, 1 \rangle$? Let’s draw a diagram of this point:
This is a right-angled triangle where the longest side has length $1$, and the other two sides have lengths $x$ and $y$. We can use trig identities to work out the value of $x$ and $y$.
If we remember some trigonometric functions, we get:
This gives us a mapping between triangular and Cartesian coordinates:
which combines to give:
Now let’s use this mapping to turn our nice human-friendly triangular coordinates into Cartesian coordinates.
(You could work out the decimal value of $\cos(60^\circ)$ and $\sin(60^\circ)$ now, but I prefer to keep them in this “original” form for as long as possible. It makes it clearer where the values come from, and it means we don’t get any loss of precision from the conversion to decimal.)
Could we use an SVG transformation?
It turns out that SVG already has some support for transformations. You can do rotations and translations – or you can use a matrix transformation to translate between coordinate systems, which is exactly what we’re doing here. We can express our coordinate mapping as a matrix:
If you wanted to use this function to draw a hexagon from the coordinates we wrote out above, you can use the following SVG transformation:
<svg viewBox="0 0 15 2" xmlns="http://www.w3.org/2000/svg">
  <g transform="matrix(1 0 0.5 .866025404 0 0)">
    <polygon points="1,0 2,0 2,1 1,2 0,2 0,1" fill="black" />
    <text x="2.2" y="1" fill="black" font-size="1px">a regular hexagon</text>
  </g>
</svg>
Unfortunately, this also skews any text on the image:
If your diagram doesn’t feature text or you’re okay with this degree of slanting, go ahead and use this transform function – it’s pretty simple and doesn’t require anything outside the raw SVG. Unfortunately I do have triangular diagrams where I want to put text, so I had to come up with an alternative approach.
Transforming the coordinates with a template
Rather than transforming the entire canvas, let’s create the necessary $(x,y)$-coordinates individually inside the SVG. We’ll define everything in terms of triangular coordinates, then use a string substitution to replace them with $(x,y)$ values.
There are lots of ways to do string substitution (or string templating). For this simple example I’m going to use Python f-strings, but the same idea can be adapted to other languages/libraries.
Let’s start by defining a function that gives us the $x$- and $y$-components for a set of triangular coordinates in an SVG-compatible format:
import math


def x_component(triangular_x, triangular_y):
    result = triangular_x + triangular_y * math.cos(math.radians(60))
    return "%.6f" % result


def y_component(triangular_x, triangular_y):
    result = triangular_y * math.sin(math.radians(60))
    return "%.6f" % result


def xy_position(triangular_x, triangular_y):
    return "%s,%s" % (
        x_component(triangular_x, triangular_y),
        y_component(triangular_x, triangular_y)
    )
I’m casting to a string with up to 6 decimal places, rather than relying on Python’s string formatting – sometimes the str() of a float is non-numeric. This often occurs with very small numbers, e.g. 1.2e-15. I want to keep my numbers nice and simple for the SVG!
Then to create the SVG itself, I drop those values into an XML template in an f-string:
print(f'''
<svg viewBox="0 0 15 2" xmlns="http://www.w3.org/2000/svg">
  <polygon points="{xy_position(1, 0)}
                   {xy_position(2, 0)}
                   {xy_position(2, 1)}
                   {xy_position(1, 2)}
                   {xy_position(0, 2)}
                   {xy_position(0, 1)}" fill="black" />
  <text x="{x_component(2.2, 1)}"
        y="{y_component(2.2, 1)}"
        fill="black" font-size="1px">
    a regular hexagon
  </text>
</svg>
''')
Because SVG isn’t fussy about whitespace, I can indent to maximise clarity – for example, it’s clear that the $x$- and $y$-components of the <text> tag are both from the same underlying triangular coordinates.
You can do the same thing in a more sophisticated templating engine, like Jinja2 or Mako. Using a templating language means you have to do less busywork when writing the SVG – you get things like loops, variables, and functions. It reduces the amount of XML you have to write by hand, and the likelihood of a typo or a silly mistake. I created most of the illustrations in this post with Jinja2.
The SVG this code creates draws the triangular coordinates correctly, but this time the text is displayed upright:
And voila: I started from a hexagon defined in triangular coordinates, and I was able to create an SVG that reflects that image. What’s especially nice is that the template contains the original triangular coordinates, so if I want to change something I still have those available – I don’t have to unpick the Cartesian coordinates that get dropped into the SVG.
Next steps
I want to keep playing with SVG, and use it for more diagrams (both here and elsewhere). Doing the research for this post was good practice, and it exposed me to several new ideas – matrix transformations, scaling, and the arc used to display the angle in the right-angled triangle.
The triangular coordinate code is a stepping stone to something else, and as I was working on it I realised it was a useful standalone idea. I’ll probably write up the original idea soon; in the meantime, I hope this was an interesting walkthrough one way to do alternative coordinate systems in SVG.