Visualising how often I write in my journal
I try to write a daily journal, and I find it useful when I do, but I’ve been struggling to sustain the habit. My journals are an opportunity for reflection and thought, and a way to spot where I should be making changes. If I don’t write a journal, I miss that opportunity.
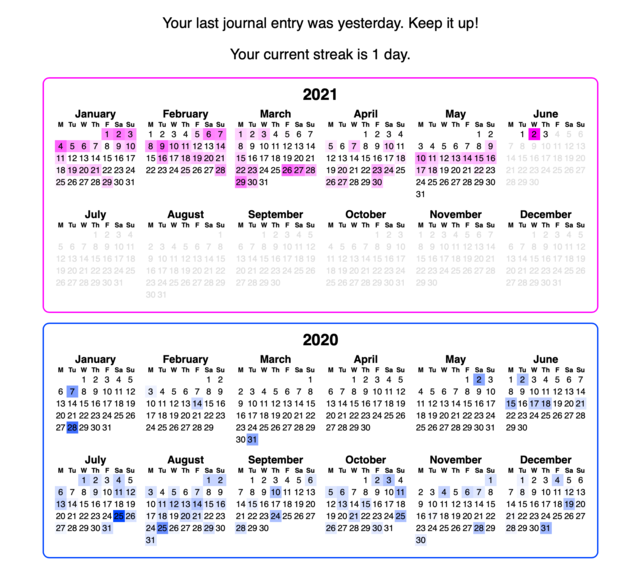
Last night, I wrote a quick Python script that visually shows me when I’ve been journalling. This is the sort of visualisation I find quite helpful:

Days when I’ve written a journal entry are highlighted in colour, with a darker shade on days when I wrote more.
The message at the top tells me my current streak – how many days up to now I’ve written a journal. I find streaks particularly motivating – once started, I don’t want to break it! – and I’ve used them to great effect when making changes to my fitness and personal finances. I’m hoping to get a similar improvement here.
If you’re interested, you can download my script:
The code is pretty rough and probably won’t work for anybody else’s setup, but it has some ideas I thought worth discussing in more detail:
I store my journal entries as text files, one per day. Every day, I start a new journal entry with the snippet
;dj, which expands todate: 2021-06-03 tags: #daily-journal Prompts: family, friends, home, work, craft, entertainment, embodiment, exercise, diet, skills ## What did I do? ## How am I feeling? ## What do I want to change?I use the
date/tagsheader in all my text files. The tag allows me to filter for journal entries in Obsidian, my note-taking app, and my script can easily extract the date.The prompts and headings give me ideas for what I want to write about. I change them on a regular basis, and part of what I want to track is whether my choice of prompt affects my journalling. I feel like some prompts get better results than others.
I wrote my script because I have a radically different prompt for June, and I want to see if it has any effect.
A darker shade means that I wrote more in that entry. This is based on the metric “file size” rather than “words written”, because I wanted something fast and approximate, rather than slow and accurate.
The Python standard library includes HTMLCalendar, a class for generating HTML calendars. My script uses a modified version which adds a
day-YYYY-MM-DDid to every cell, so I can select individual days in CSS to add the shading.Calendars are quite fiddly, so it’s nice to have one available with minimal work on my part.
I wanted each year to have a different colour (because pretty), but I also wanted the colours to be consistent between different runs of the script. I choose the colour for a year like so:
import colorsys
import random

rand = random.Random(year)
hue = rand.random()
r, g, b = colorsys.hsv_to_rgb(hue, 1, 1)
By seeding the
randommodule, I get consistent output. I then choose a value between 0 and 1, which I use as the hue in the hue-saturation-value (HSV) colour space.
This code is pretty slapdash, but I’m not going to go back and tidy it up. It works, and that’s good enough for now. Tempting as it would be to keep fiddling, it would just distract me from the greater goal: actually writing my journal.
