Tiling the plane with Pillow
On a recent yak-shaving exercise, I’ve been playing with Pillow, an imaging library for Python. I’ve been creating some simple graphics: a task for which I usually use PGF or TikZ, but those both require LaTeK. In this case, I didn’t have a pre-existing LaTeK installation, so I took the opportunity to try Pillow, which is just a single pip install.1
It was a pleasant surprise to learn that Pythonista includes Pillow, so I could work on this code while walking to work.
Along the way, I had to create a regular tiling with Pillow. In mathematics, a tiling is any arrangement of shapes that completely covers the 2D plane (a flat canvas), without leaving any gaps. A regular tiling is one in which every shape is a regular polygon – that is, a polygon in which every angle is equal, and every side has the same length.
There are just three regular tilings of the plane: with squares, equilateral triangles, and regular hexagons. Here’s what they look like, courtesy of Wikipedia:
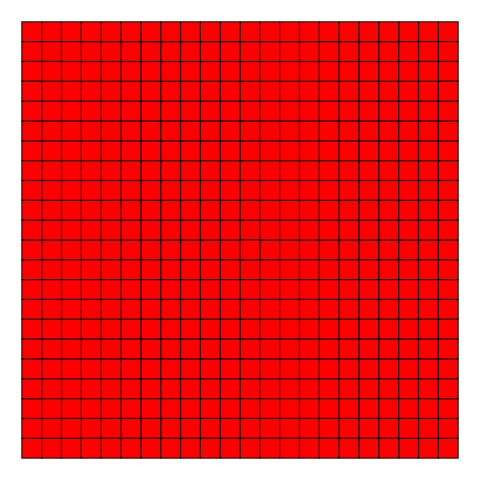 | 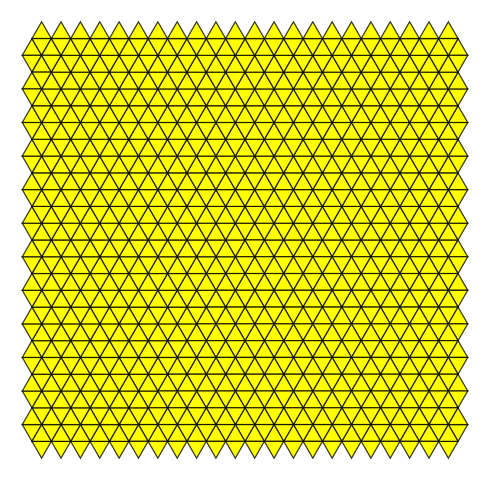 | 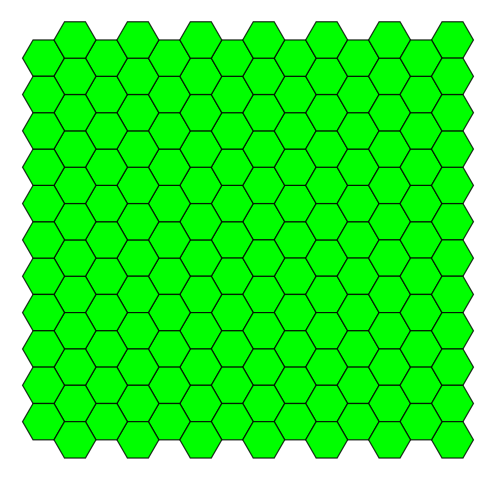 |
In this post, I’ll explain how I reproduced this effect with Pillow. This is a stepping stone for something bigger, which I’ll write about in a separate post.
If you just want the code, it’s all in a script you can download.
Coordinate systems
To do any drawing, first we need to establish a coordinate system.
The usual (x, y) coordinate system has two perpendicular axes. There’s an origin at (0, 0), and values increase as you move bottom-to-top, left-to-right.
In Pillow, this is flipped vertically: an increase in the vertical axis means moving down, not up. The origin is the top left-hand corner of an image, and the image canvas sits below and to the right.
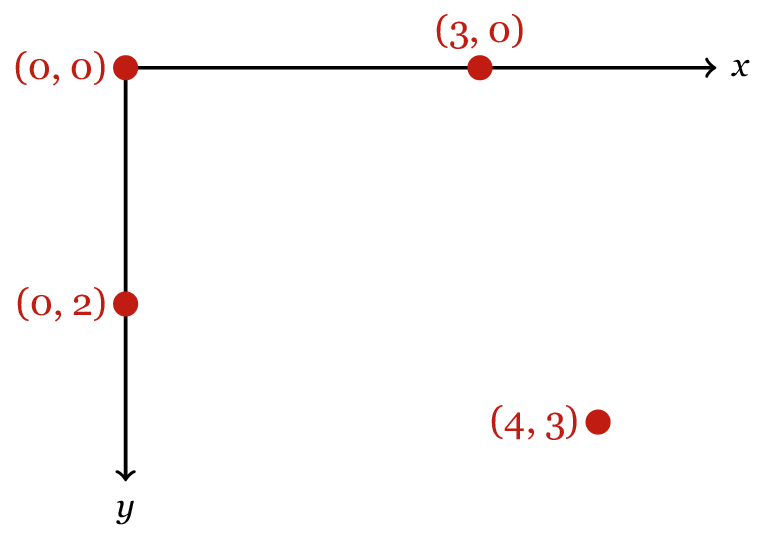
Practically speaking, this doesn’t change much – but it’s worth noting the difference, or drawings can behave in a confusing manner.
Drawing a polygon
Once you have a coordinate system, a polygon can be specified as a list of coordinate points: one for every vertex. This is a list of 2-tuples in Python, which looks very similar to mathematical notation. For example, a rectangle:
rectangle = [(0, 0), (0, 30), (100, 30), (100, 0)]
In Pillow, an image is represented by an instance of the Image class. We can draw shapes on the image using the ImageDraw module, passing it a list of coordinate points. For example, to draw this rectangle on a blank canvas:
from PIL import Image, ImageDraw

# Create a blank 500x500 pixel image
im = Image.new('L', size=(500, 500))

# Draw the square
ImageDraw.draw(im).polygon(rectangle)

# Save the image to disk
im.save('rectangle.png')
We can call this draw(im) function as many times as we like. So if we had an iterable that gave us coordinates, we could draw multiple shapes on the canvas:
for coords in coordinates:
    ImageDraw.draw(im).polygon(coords)
So now we need to write some code that provides us with these coordinates.
A square grid
Because a square corresponds so neatly to the coordinate system, it’s a good place to start. Let’s start by thinking about a single point (x, y): suppose this is the top left-hand corner of a unit square, and then we can write down the other three vertices of the square:
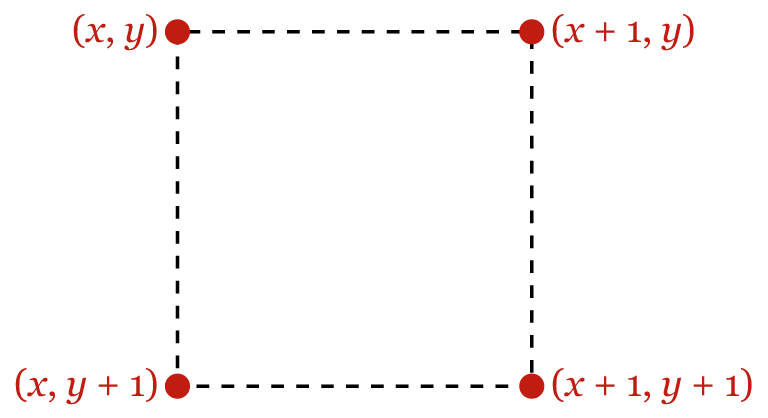
We can get these points (x, y) by iterating over the integer coordinates of the canvas, like so:
def generate_unit_squares(image_width, image_height):
    """Generate coordinates for a tiling of unit squares."""
    for x in range(image_width):
        for y in range(image_height):
            yield [(x, y), (x + 1, y), (x + 1, y + 1), (x, y + 1)]
I’m using yield to make this function into a generator. This allows me to efficiently compute all the coordinates required, even when I have many shapes. Iteration is a very powerful feature in Python, and if you’re not familiar with it, I recommend this old PyCon talk as a good introduction.
To create bigger squares, we scale the coordinates in both directions:
def generate_squares(image_width, image_height, side_length=1):
    """Generate coordinates for a tiling of squares."""
    scaled_width = int(image_width / side_length) + 2
    scaled_height = int(image_height / side_length) + 2
    for coords in generate_unit_squares(scaled_width, scaled_height):
        yield [(x * side_length, y * side_length) for (x, y) in coords]
If we drop this generator into the code in the previous section, we get a nice tiling of black and white squares:

Not very colourful, but it illustrates the point. Onwards!
A triangle party
Unlike squares or hexagons, you can’t tile the plane with triangles without varying the orientation: half your triangles have to be flipped vertically to fill in the gaps. So to simplify the problem, let’s start by gluing two triangles together, to give us a rhombus shape:
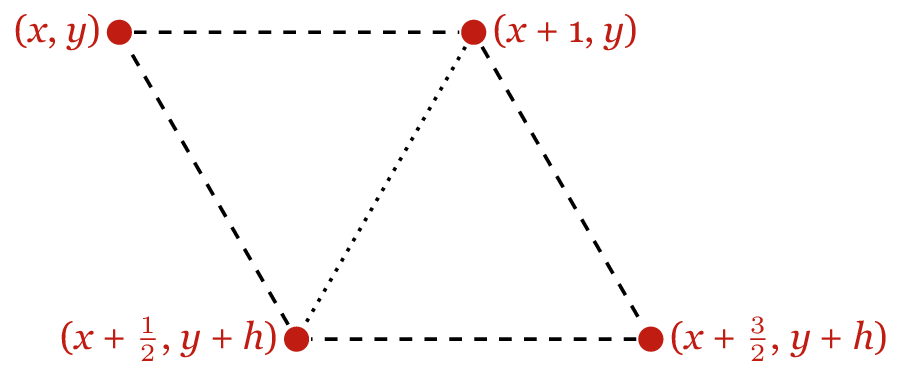
If we can tile the plane with these rhombuses (which all have the same orientation), then we’ll have the coordinates of our triangles.
We can take the same approach we did with the square: suppose a point (x, y) is the upper left-hand corner of our shape, and write down the remaining coordinates. I’ve drawn this above for a rhombus with sides of length 1. Here h is the height of the rhombus, which is sin(60°).
With this in hand, we have enough to start writing a second generator:
import math

def generate_unit_triangles(image_width, image_height):
    """Generate coordinates for a tiling of unit triangles."""

    # math.sin() works in radians, not degrees
    h = math.sin(math.pi / 3)

    for x in range(image_width):
        for y in range(int(image_height / h)):
            yield [(x, y * h), (x+1, y * h), (x+0.5, (y+1) * h)]
            yield [(x+1, y * h), (x+1.5, (y+1) * h), (x+0.5, (y+1) * h)]
The problem with this code is that the triangles it generates are the same on each row, so the edges don’t line up nicely. Here’s what that looks like:

What we need to do is add a horizontal offset on every other row. By shifting all the triangles along by a half unit, we can get them to line up nicely. Like so:
import math

def generate_unit_triangles(image_width, image_height):
    """Generate coordinates for a tiling of unit triangles."""
    h = math.sin(math.pi / 3)

    # The first triangle starts beyond the left-hand side of the image,
    # and is only partially visible.  This lets us cover the whole image.
    # Likewise we add an extra row to cover the bottom.
    for x in range(-1, image_width):
        for y in range(int(image_height / h) + 1):

            # Add a horizontal offset on odd numbered rows
            x_ = x if (y % 2 == 0) else x + 0.5

            yield [(x_, y * h), (x_+1, y * h), (x_+0.5, (y+1) * h)]
            yield [(x_+1, y * h), (x_+1.5, (y+1) * h), (x_+0.5, (y+1) * h)]
Finally, to create bigger triangles, we add a scaling factor:
def generate_triangles(image_width, image_height, side_length=1):
    """Generate coordinates for a regular tiling of triangles."""
    scaled_width = int(image_width / side_length) + 2
    scaled_height = int(image_height / side_length) + 2

    for coords in generate_unit_triangles(scaled_width, scaled_height):
        yield [(x * side_length, y * side_length) for (x, y) in coords]
Notice that this is very similar for our code for scaling the square grid, so let’s pull that out into a common function:
def _scale_coordinates(generator, image_width, image_height, side_length=1):
    scaled_width = int(image_width / side_length) + 2
    scaled_height = int(image_height / side_length) + 2

    for coords in generator(scaled_width, scaled_height):
        yield [(x * side_length, y * side_length) for (x, y) in coords]

def generate_squares(*args, **kwargs):
    """Generate coordinates for a tiling of squares."""
    return _scale_coordinates(generate_unit_squares, *args, **kwargs)

def generate_triangles(*args, **kwargs):
    """Generate coordinates for a tiling of triangles."""
    return _scale_coordinates(generate_unit_triangles, *args, **kwargs)
And voila, a triangle party:

Only one left to go.
A hexagon honeycomb
Let’s repeat the same approach as we used for the square and the triangle: pick a point (x, y), and write down the coordinates of the other points. This is what it looks like for a unit hexagon:
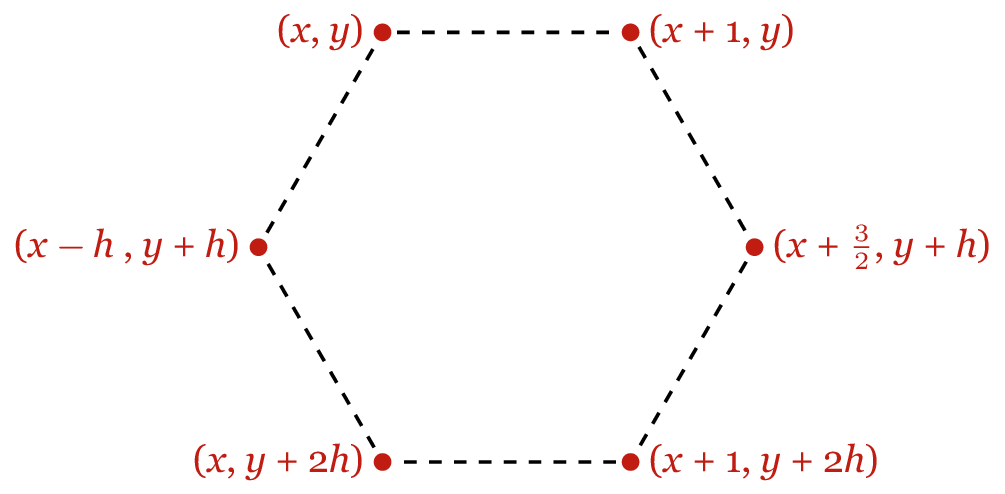
Note that h has the same value as in the previous section – sin(60°) – so the whole hexagon’s height is 2h.
Now we need to think about where to put the (x, y).
If you look at each row, the individual hexagons are offset by 3 horizontal units: that’s to leave a gap for the hexagon on the next row. Here are two hexagons from the same row, with one hexagon from the next row:
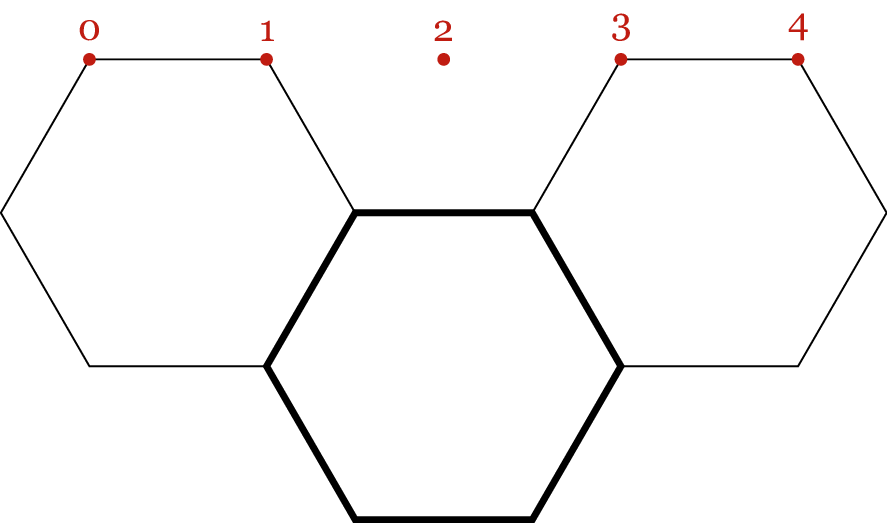
So in the horizontal direction, we need to be incrementing by 3 units, and vertically we’re incrementing by h. Note also that we need to have that half-width offset on alternate rows, as we did with triangles.
This is a bit fiddlier, but comes out like so:
def generate_unit_hexagons(image_width, image_height):
    """Generate coordinates for a tiling of unit hexagons."""
    # Half the height of the hexagon
    h = math.sin(math.pi / 3)

    for x in range(-1, image_width, 3):
        for y in range(-1, int(image_height / h) + 1):

            # Add the horizontal offset on every other row
            x_ = x if (y % 2 == 0) else x + 1.5

            yield [
                (x_,        y * h),
                (x_ + 1,    y * h),
                (x_ + 1.5, (y + 1) * h),
                (x_ + 1,   (y + 2) * h),
                (x_,       (y + 2) * h),
                (x_ - 0.5, (y + 1) * h),
            ]
And with our scaling function, we can easily extend this to draw hexagons of arbitrary size:
def generate_hexagons(*args, **kwargs):
    """Generate coordinates for a tiling of hexagons."""
    return _scale_coordinates(generate_unit_hexagons, *args, **kwargs)
Which this gives us the honeycomb:

And that’s the final tiling of the plane.
Putting it all together
In this post, we’ve seen the three regular tilings of the coordinate plane, and how to generate them with Pillow. If you’d like to get all the code I’ve written in this post, you can download a single file that contains everything. I didn’t set out to draw regular tilings: this became the stepping stone to a larger project, but I’ll write about that separately.
As a sidebar, it’s been nice to do a bit of maths again. Admittedly, plane geometry isn’t particularly taxing for me, but I’m starting to stretch those muscles again. When I left university two years ago, I was a bit burnt out on maths, and I haven’t done any for a while. I’m looking forward to doing more of it in the near future. Watch this space!
I still write the vast majority of my code on a traditional computer, but occasionally I use Pythonista on my phone. ↩