Finding the CPU and memory bottlenecks in an ECS cluster
At work, we use Amazon’s EC2 Container Service (ECS) to run some of our applications. ECS is a service for orchestrating Docker containers – you describe a collection of containers you want to run, and then ECS finds somewhere to start them.
If you look in the ECS console, you can see graphs of the CPU and memory utilisation for an app:
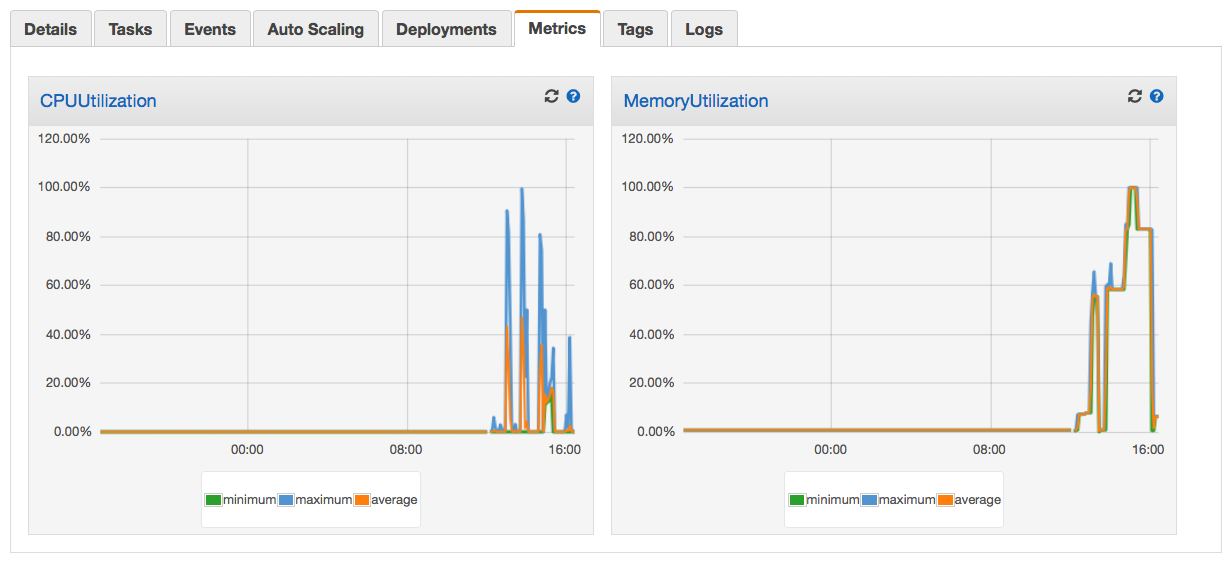
At a glance, this gives a clue about whether any apps are bottlenecked by CPU or memory. In this case, we can see there were periods when the app was using 100% of its provisioned CPU and memory – so we might be able to make it run faster by increasing its available resources. But we have a lot of apps in ECS, and clicking around in the console is slow and boring. These stats are all available through AWS APIs – so could we get this data programatically?
I’ve written a script that gives me a quick snapshot of CPU and memory usages across an ECS cluster, and highlights possible bottlenecks:
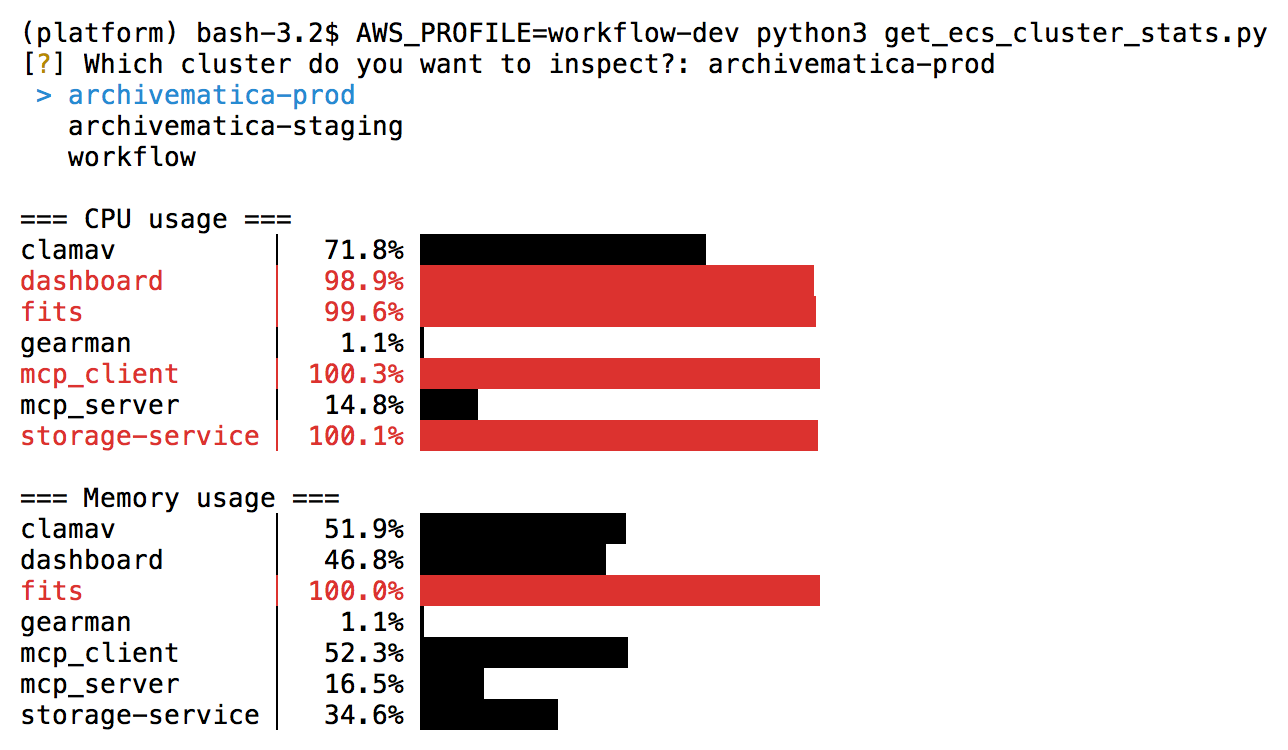
You can walk through how I wrote this script below, or scroll to the end if you just want the code.
Some ECS terminology
In ECS, a task definition describes a collection of containers you want to run together, and any of the parameters you need to start them. For example, “run three app containers and one nginx container”. It might include the Docker image you want to run, the CPU and memory to provision, or the environment variables to pass to the containers.
A service tells ECS how many instances of a task definition to run. The ECS scheduler will start or stop containers to give you the desired number of tasks in a service. This includes restarting containers if a task unexpectedly stops running.
An ECS cluster is a collection of tasks and services that run together. For example, all the tasks in a cluster might run on the same container hosts. Each service belongs to a cluster.
Looking up a single CPU/memory utilization metric
The graph in the ECS console is created from CloudWatch Metrics. If you click the title of the graph, you’re taken to the CloudWatch console, where you can see a bigger, interactive version of the graph:
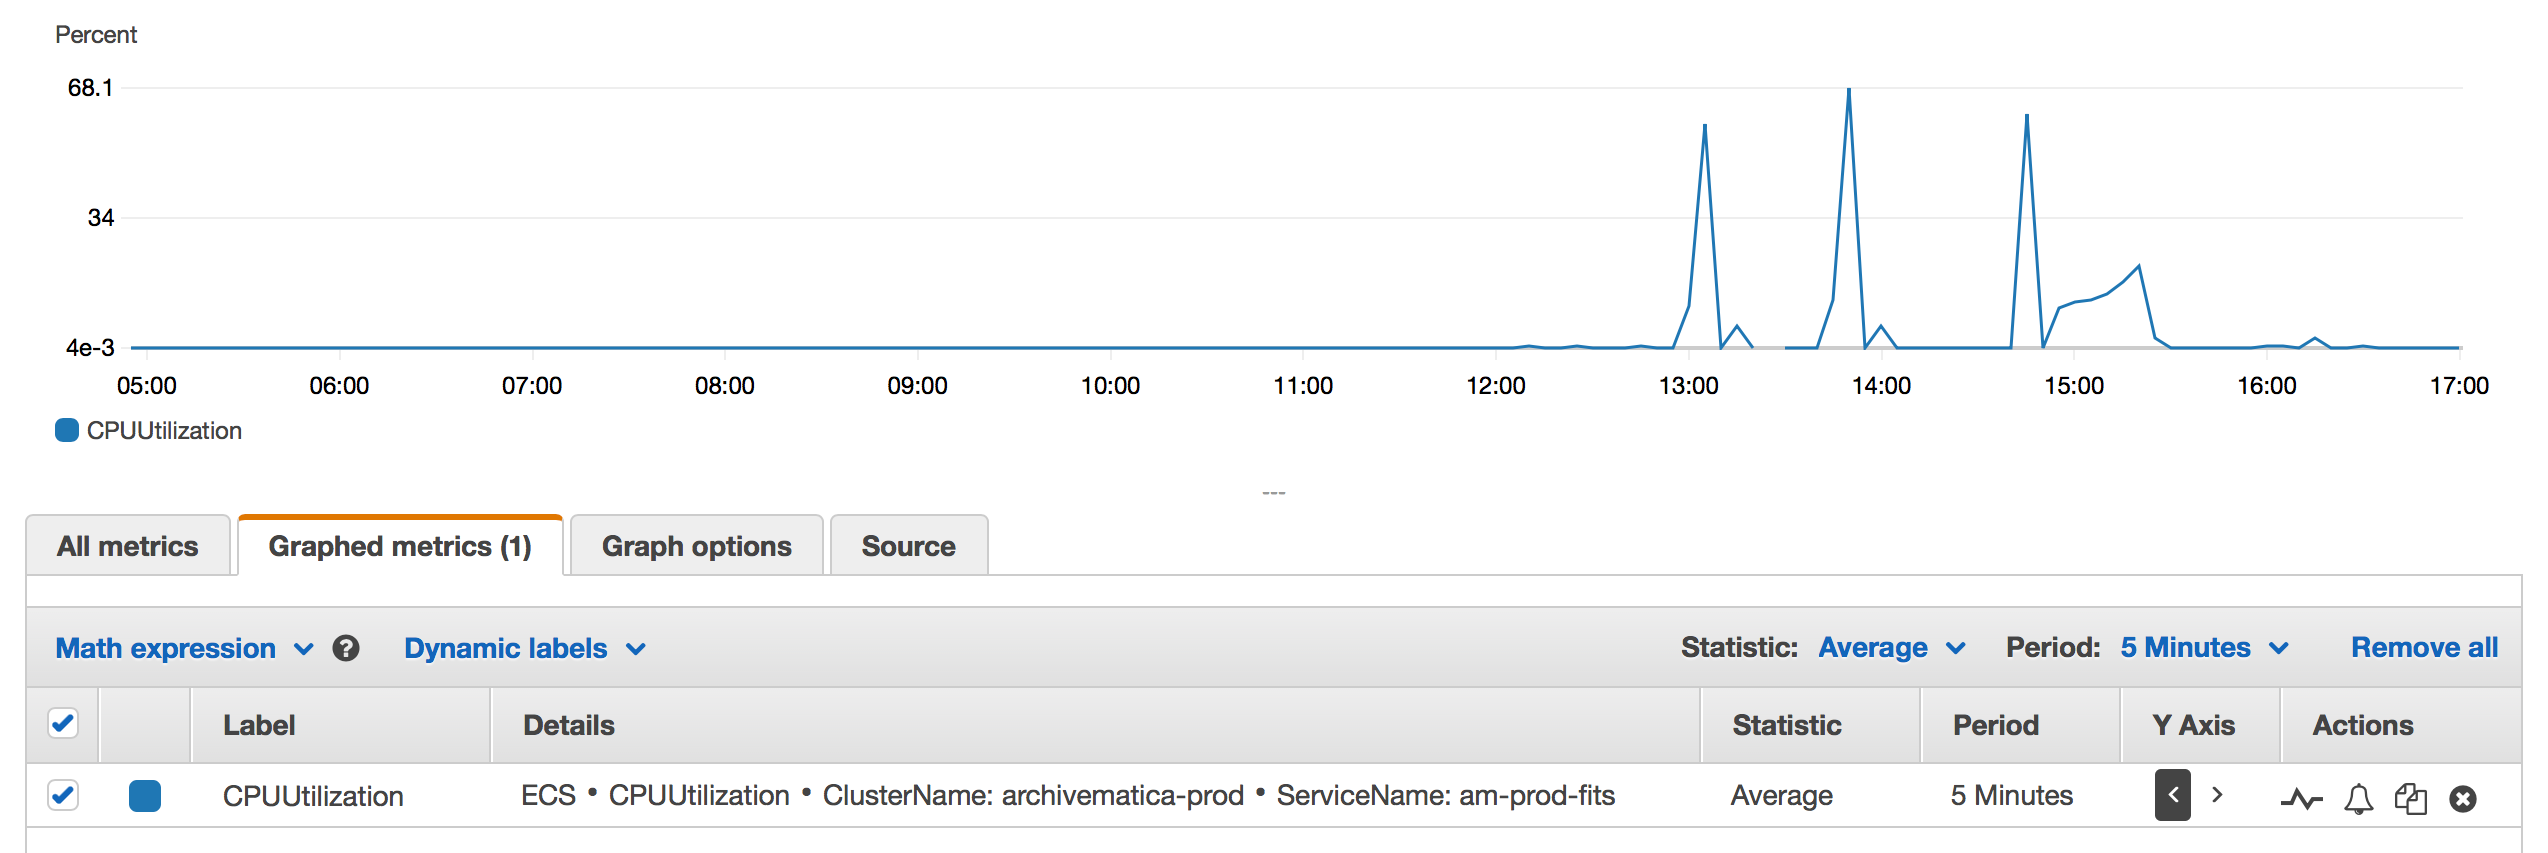
This gives us the clues we need to look up these values programatically. The GetMetricStatistics API takes a handful of parameters, which we can match to the parameters in this screenshot:
import datetime

import boto3

cloudwatch = boto3.client("cloudwatch")

data = cloudwatch.get_metric_statistics(
    Namespace="AWS/ECS",
    MetricName="CPUUtilization",
    Dimensions=[
        {"Name": "ClusterName", "Value": "archivematica-prod"},
        {"Name": "ServiceName", "Value": "am-prod-fits"},
    ],
    StartTime=datetime.datetime.now() - datetime.timedelta(hours=24),
    EndTime=datetime.datetime.now(),
    Period=3600,
    Statistics=["Maximum"]
)

print(resp)
This will get the maximum value of the CPUUtilization metric for this service over the last 24 hours, returning one value per hour (that’s the Period=3600 bit). Here’s what the result looks like:
{
  'Label': 'CPUUtilization',
  'Datapoints': [
    {
      'Timestamp': datetime.datetime(2020, 1, 3, 15, 14, tzinfo=tzutc()),
      'Maximum': 34.37699317932129,
      'Unit': 'Percent'
    },
    ...
  ]
}
We can look up the maximum value over the 24 hour period like so:
max_value = max(dp["Maximum"] for dp in resp["Datapoints"])
Occasionally this might throw a ValueError “max() arg is an empty sequence”, if there are no data points in the response. Some of our apps stop running if they don’t have any work to do, so you won’t get any CPU utilisation statistics. We can handle that case as so:
try:
    max_value = max(dp["Maximum"] for dp in resp["Datapoints"])
except ValueError:
    max_value = 0.0
Let’s put this all into a reusable function:
import datetime

import boto3


cloudwatch = boto3.client("cloudwatch")


def _get_max_metric_value(
    *, metric_name, cluster_name, service_name, start_time, end_time
):
    """
    Look up the maximum value of an ECS metric over the last 24 hours.
    """
    resp = cloudwatch.get_metric_statistics(
        Namespace="AWS/ECS",
        MetricName=metric_name,
        Dimensions=[
            {"Name": "ClusterName", "Value": cluster_name},
            {"Name": "ServiceName", "Value": service_name},
        ],
        StartTime=start_time,
        EndTime=end_time,
        Period=3600,
        Statistics=["Maximum"]
    )

    try:
        return max(dp["Maximum"] for dp in resp["Datapoints"])
    except ValueError:
        return 0.0


def get_max_cpu_utilisation(**kwargs):
    return _get_max_metric_value(metric_name="CPUUtilization", **kwargs)


def get_max_memory_utilisation(**kwargs):
    return _get_max_metric_value(metric_name="MemoryUtilization", **kwargs)
So now we can get CPU and memory statistics for a single service – next, let’s work out what services we want to check.
Listing all the services in a cluster
An ECS cluster is a way to group related services together. For example, we have separate clusters for our live and our staging apps.
The ListServices API lets us get a list of the ARNs (Amazon Resource Names – the IDs of AWS) for every service in a cluster, like so:
ecs = boto3.client("ecs")

resp = ecs.list_services(cluster="archivematica-prod")

print(resp["serviceArns"])
However, this API is paginated – if we have lots of services, it only returns the first 10. If we want to get the full set, it’s safer to use a boto3 paginator:
def list_services(cluster):
    """Generates the ARN of every service in an ECS cluster."""
    paginator = ecs.get_paginator("list_services")

    for page in paginator.paginate(cluster=cluster):
        yield from page["serviceArns"]
So how do we know what cluster to look at?
Asking the user to choose a cluster
In the past, I’ve written scripts that take the name of the cluster as a command line argument. That’s simple to implement, but fiddly for the person who runs the script – they have to know the exact name of the cluster, and if they make a typo it doesn’t work. I wanted to try a different approach with this script.
We’ve already seen we can query the ECS API for a list of services: how about querying it for a list of clusters, and asking the user to pick one on the command line?
Similar to ListServices, the ECS API has a ListClusters API that lets us look up all the ECS clusters in an account. We can write a function that gets us all the cluster ARNs, just like the one in the previous section:
def list_clusters():
    """Generates the ARN of every ECS cluster in an account."""
    paginator = ecs.get_paginator("list_clusters")

    for page in paginator.paginate():
        yield from page["clusterArns"]
This gives us a list of cluster ARNs – but how do we pick? We can knock out two cases pretty easily: if there’s only one cluster, we use that one, and if there aren’t any, we throw an error.
def choose_cluster():
    all_clusters = list(list_clusters())

    if len(all_clusters) == 0:
        raise RuntimeException("No ECS clusters found in account!")
    elif len(all_clusters) == 1:
        return all_clusters[0]
    else:
        ...
What about that last case? What if there are multiple clusters to pick from? At this point, I’ll turn to the inquirer module, which gives you a bunch of tools for interactive command line interfaces. I’ve been playing with it recently, and I really like what it provides. In particular, it can show the user a list of choices, and ask them to select one of them.
Here’s the code for that else: branch:
    else:
        # AWS cluster ARNs are of the form
        #
        #       arn:aws:ecs:eu-west-1:{account_id}:cluster/{cluster_name}
        #
        # Although we'll use the full cluster ARN to list the services it
        # contains, we can ask the user to select a cluster based on the
        # names alone.
        clusters = {
            cluster_arn.split("/")[-1]: cluster_arn
            for cluster_arn in all_clusters
        }

        question = inquirer.List(
            "cluster_name",
            message="Which cluster do you want to inspect?",
            choices=sorted(clusters.keys())
        )

        answers = inquirer.prompt([question])
        cluster_name = answers["cluster_name"]
        return clusters[cluster_name]
This is what the interface looks like:
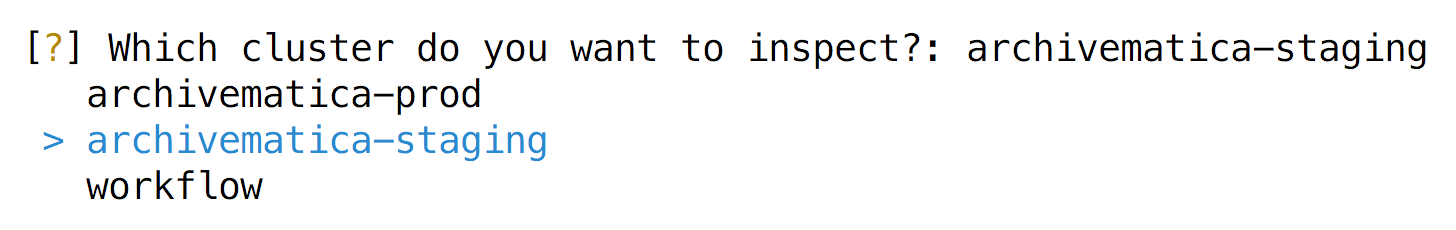
You can use arrow keys to move up and down and select an option, then press “enter” to accept it. It’s less typing, and less risk of a typo messing up your selection.
Displaying the data
So now we can ask the user to select a cluster, get a list of all the services in that cluster, and look up the CPU/memory statistics for that service. How do we display that to the user?
I’ve done a bit of this before – two years ago I wrote a post about drawing ASCII bar charts in Python, and that code is pretty useful here. I’m not going to go through it again, just note a couple of tweaks I’ve made to the code from that post, in particular:
- removing common prefixes from the service names
- the CPU/memory utilisation results are a percentage, so should cap out at ~100%
- highlight anything over 95% in red using the termcolor module, because that’s what I’m looking for
- tweak the value code to show decimal numbers, not just whole integers
Here’s what the revised bar chart function looks like:
import os

import termcolor


def draw_bar_chart(data):
    # A lot of our services have a common prefix in the name, e.g. everything
    # in the storage-prod cluster is called storage-prod_register,
    # storage-prod_replicator, and so on.
    #
    # While helpful for disambiguating in absolute terms, it's visual noise here.
    # Remove any common prefix.
    common_label_prefix = os.path.commonprefix([label for label, _ in data])
    data = [
        (label[len(common_label_prefix):].lstrip("-").lstrip("_"), value)
        for label, value in data
    ]

    # The values are percentages so should max out at 100, but somewhere
    # in CloudWatch they occasionally come out as slightly over 100.
    # Treat the top value as 110 to allow a bit of slop.
    max_value = 110.0

    increment = max_value / 25

    longest_label_length = max(len(label) for label, _ in data)

    for label, count in sorted(data):

        # The ASCII block elements come in chunks of 8, so we work out how
        # many fractions of 8 we need.
        # https://en.wikipedia.org/wiki/Block_Elements
        bar_chunks, remainder = divmod(int(count * 8 / increment), 8)

        # First draw the full width chunks
        bar = '█' * bar_chunks

        # Then add the fractional part.  The Unicode code points for
        # block elements are (8/8), (7/8), (6/8), ... , so we need to
        # work backwards.
        if remainder > 0:
            bar += chr(ord('█') + (8 - remainder))

        # If the bar is empty, add a left one-eighth block
        bar = bar or  '▏'

        line = f'{label.ljust(longest_label_length)} ▏ {count:#5.1f}% {bar}'

        if count > 95:
            print(termcolor.colored(line, "red"))
        else:
            print(line)
Putting it all together
If we combine all the functions above, and put them into a single script, here’s what we come up with:
#!/usr/bin/env python
"""
Find the CPU/memory bottlenecks in an ECS cluster.

This script will look for ECS clusters in your AWS account, ask you to pick
one, then show you peak CPU/memory utilisation over the last 24 hours.
It's a good way to identify apps that might be under-provisioned, and benefit
from being given more resources.

Python 3.6+.
"""

import datetime
import os

import boto3
import inquirer
import termcolor


cloudwatch = boto3.client("cloudwatch")
ecs = boto3.client("ecs")


def _get_max_metric_value(
    *, metric_name, cluster_name, service_name, start_time, end_time
):
    """
    Look up the maximum value of an ECS metric over the last 24 hours.
    """
    resp = cloudwatch.get_metric_statistics(
        Namespace="AWS/ECS",
        MetricName=metric_name,
        Dimensions=[
            {"Name": "ClusterName", "Value": cluster_name},
            {"Name": "ServiceName", "Value": service_name},
        ],
        StartTime=start_time,
        EndTime=end_time,
        Period=3600,
        Statistics=["Maximum"]
    )

    try:
        return max(dp["Maximum"] for dp in resp["Datapoints"])
    except ValueError:
        return 0.0


def get_max_cpu_utilisation(**kwargs):
    return _get_max_metric_value(metric_name="CPUUtilization", **kwargs)


def get_max_memory_utilisation(**kwargs):
    return _get_max_metric_value(metric_name="MemoryUtilization", **kwargs)


def list_services(cluster):
    """Generates the ARN of every service in an ECS cluster."""
    paginator = ecs.get_paginator("list_services")

    for page in paginator.paginate(cluster=cluster):
        yield from page["serviceArns"]


def list_clusters():
    """Generates the ARN of every ECS cluster in an account."""
    paginator = ecs.get_paginator("list_clusters")

    for page in paginator.paginate():
        yield from page["clusterArns"]


def choose_cluster():
    """
    Get a list of the ECS clusters running in this account, and choose
    one to inspect – possibly asking the user to choose from a list.
    """
    all_clusters = list(list_clusters())

    if len(all_clusters) == 0:
        raise RuntimeException("No ECS clusters found in account!")
    elif len(all_clusters) == 1:
        return all_clusters[0]
    else:
        # AWS cluster ARNs are of the form
        #
        #       arn:aws:ecs:eu-west-1:{account_id}:cluster/{cluster_name}
        #
        # Although we'll use the full cluster ARN to list the services it
        # contains, we can ask the user to select a cluster based on the
        # names alone.
        clusters = {
            cluster_arn.split("/")[-1]: cluster_arn
            for cluster_arn in all_clusters
        }

        question = inquirer.List(
            "cluster_name",
            message="Which cluster do you want to inspect?",
            choices=sorted(clusters.keys())
        )

        answers = inquirer.prompt([question])
        cluster_name = answers["cluster_name"]
        return clusters[cluster_name]


def draw_bar_chart(data):
    # A lot of our services have a common prefix in the name, e.g. everything
    # in the storage-prod cluster is called storage-prod_register,
    # storage-prod_replicator, and so on.
    #
    # While helpful for disambiguating in absolute terms, it's visual noise here.
    # Remove any common prefix.
    common_label_prefix = os.path.commonprefix([label for label, _ in data])
    data = [
        (label[len(common_label_prefix):].lstrip("-").lstrip("_"), value)
        for label, value in data
    ]

    # The values are percentages so should max out at 100, but somewhere
    # in CloudWatch they occasionally come out as slightly over 100.
    # Treat the top value as 110 to allow a bit of slop.
    max_value = 110.0

    increment = max_value / 25

    longest_label_length = max(len(label) for label, _ in data)

    for label, count in sorted(data):

        # The ASCII block elements come in chunks of 8, so we work out how
        # many fractions of 8 we need.
        # https://en.wikipedia.org/wiki/Block_Elements
        bar_chunks, remainder = divmod(int(count * 8 / increment), 8)

        # First draw the full width chunks
        bar = '█' * bar_chunks

        # Then add the fractional part.  The Unicode code points for
        # block elements are (8/8), (7/8), (6/8), ... , so we need to
        # work backwards.
        if remainder > 0:
            bar += chr(ord('█') + (8 - remainder))

        # If the bar is empty, add a left one-eighth block
        bar = bar or  '▏'

        line = f'{label.ljust(longest_label_length)} ▏ {count:#5.1f}% {bar}'

        if count > 95:
            print(termcolor.colored(line, "red"))
        else:
            print(line)


if __name__ == "__main__":
    cluster_arn = choose_cluster()

    cpu_stats = []
    memory_stats = []

    cluster_name = cluster_arn.split("/")[-1]

    now = datetime.datetime.now()
    start_time = now - datetime.timedelta(hours=24)

    for service_arn in list_services(cluster=cluster_name):
        # AWS service ARNs are of the form
        #
        #       arn:aws:ecs:eu-west-1:{account_id}:service/{service_name}
        #
        # We only want the service name for the CloudWatch metric.
        service_name = service_arn.split("/")[-1]

        max_cpu = get_max_cpu_utilisation(
            cluster_name=cluster_name,
            service_name=service_name,
            start_time=start_time,
            end_time=now
        )
        cpu_stats.append((service_name, max_cpu))

        max_memory = get_max_memory_utilisation(
            cluster_name=cluster_name,
            service_name=service_name,
            start_time=start_time,
            end_time=now
        )
        memory_stats.append((service_name, max_memory))

    print("=== CPU stats ===")
    draw_bar_chart(cpu_stats)

    print("")

    print("=== Memory stats ===")
    draw_bar_chart(memory_stats)
This isn’t a full-bore dashboard, but it does give me a quick snapshot of how our cluster is looking. If it highlights something in red, I go look at the more detailed graphs in CloudWatch, to find out if this was a temporary spike, or the app is consistently being bottlenecked. I’ve already used it to tweak a couple of services for better performance, and I expect to use it again next time I’m fiddling with our ECS clusters.
The AWS APIs give you very flexible access to this data, and I’ve cobbled together all sorts of scripts to ask weird questions about our infrastructure. Even if this isn’t exactly what you need, I hope it gives you an idea of the sort of thing you can do with these APIs, and how to answer specific questions about your own AWS infrastructure.