Getting a monthly cloud costs report in Slack
The AWS bill is everyone’s most expensive horror story. To help my team be more aware of what our bill looks like, I’ve set up a monthly cloud costs report that posts a shared Slack channel:
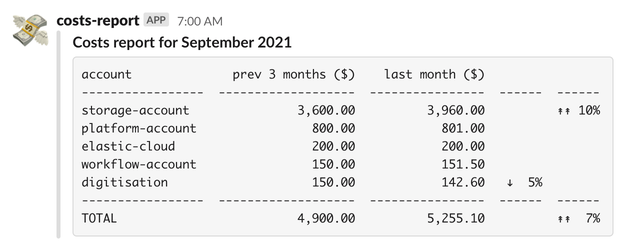
The report has one line per AWS account, plus a line for the total. Each line includes both the latest bill, and the average from the previous three months, so we can see the general direction. Significant changes (+/−5%) get called out in the rightmost column.
We’re not trying to minimise our absolute spend – our current bill is manageable, and we’d rather spend time building new features than cutting costs. Instead, we’re trying to get a better understanding of how our bill is changing, and the report highlights whether the bill is rising or falling. We don’t want our bill to grow in an unbounded way, or for reasons we can’t explain.
There might be good reasons why the bill is going up. For example, if we ingest a lot of new content in the storage service, we’d expect to see a big spike in the storage account. But if the bill doubles and nobody knows why, that needs further investigation.
We think it’s a good idea for developers to be aware of the bill. Their decisions have a direct impact on its size, and they’re well-placed to identify the source of an unexpected change.
Every developer can already see our AWS bills, but it’s scattered throughout the AWS console. They need to look at every account individually, which is a lot of point-and-clicking – so in practice, nobody does. (There is an organisation-wide billing view, but it’s managed by a different team.)
This report is posted to a shared channel at the start of every month, on the same day of the week as our planning meetings. If there is an unexpected jump, we can decide whether to schedule some cost reduction work when we plan the next sprint.
All the code for this costs report is on our GitHub, under an MIT licence. It runs as a Lambda function, triggered by a scheduled CloudWatch Event.
This report is meant to start conversations about significant changes in the bill. It started several as I was developing it, and I hope that continues with future reports.