Drawing repetitive radial artworks
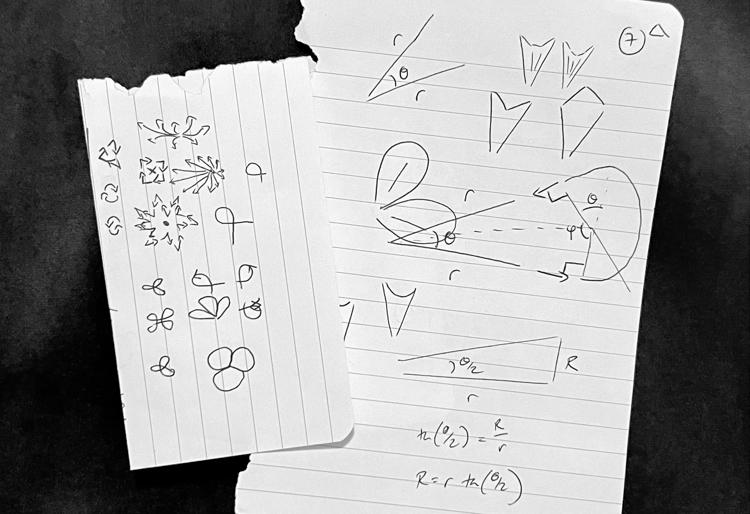
I was waiting for a meeting to start the other day, and I was idly doodling in my notebook. I’d just had a text from a friend about an upcoming trip to Ireland, and she’d sent me the four-leafed clover emoji (🍀), so I was sketching some petal-like shapes. These are a few of my doodles:
I was trying to draw various patterns that could be repeated around a central point. This is easy to imagine, but quite fiddly to do by hand. Fortunately, computers.
After my meeting, I cracked out Python and started experimenting. I wrote some scripts to generate SVG images – I’m bashing lines and curves together, and I’ve done similar stuff before.
Here’s a sample of some of the art I was able to create:
Read on to find out how I made it, and see more examples.
Polar coordinates
Normally when you draw shapes in SVG, you work in Cartesian coordinates, where points are determined by their horizontal (x) and vertical (y) distance from an origin.
Note that in SVG, the origin is the top left-hand corner of your diagram: as x increases, you move from right-to-left, and as y increases, you move from bottom-to-top. This can be confusing at first, because we’re used to y increasing in the opposite direction.
But for drawing patterns that repeat in a circle around a point, it’s easier to use polar coordinates, an alternative coordinate system where points are determined by:
- their distance from a central point (the radius)
- their angle from a specified direction (the angle)
I chose to work in a polar coordinate system where angles are measured clockwise from the upwards vertical axis, like so:
This choice of coordinates gives you a straightforward conversion between polar and Cartesian:
import math


def polar_to_cartesian(origin_x, origin_y, radius, angle):
    return {
        "x": origin_x + radius * math.cos(angle),
        "y": origin_y + radius * math.sin(angle),
    }
This helper function allows me to define my shapes with polar coordinates, then convert to Cartesian when I want to actually draw them in the SVG.
The sketches
First I drew “spokes” that emanate from the centre of the diagram. I picked a random number, then draw that many spokes which are equally-spaced around the centre:
I added a random offset angle, to rotate all the spokes slightly – this was to avoid creating a series of diagrams that all had the same vertical upward spoke at 0°. Notice how, for example, the four spokes in the first diagram aren’t perfectly horizontal or vertical.
Next I wanted to connect the spokes, to create something vaguely resembling flower petals. Initially I connected their ends with straight lines, creating sets of equal-sized triangles:
That first one reminded me of looking down at a spiral staircase. I went and manually added some colours to create the illusion of steps, and then I kept playing with more varieties:
These colours are static and hard-coded. I also played with adding animation, to create a basic colour spinner – there are a few rough edges and it’s a bit jerky, but if you’re interested, you can see what the animation looks like.
Returning to the line art, I wanted to replace those straight lines with something a bit more visually interesting.
I started with spiky “petals”. I allowed my script to choose randomly: would the spikes bend inward or outward, and by how much. The pictures I got back remind me of stars and flowers:
But the thing I really wanted was round petals – where each spoke would continue outwards, follow a circular arc, and come back to join the next spoke along. This involved a bit of trigonometry to work out the angles, and my first few attempts didn’t work – but I think they have a certain beauty all the same:
But eventually I got it all figured out, and I was able to reproduce my original idea: flower “petals” with circular ends. (And despite generating over 60 examples, I never got one with four parts. Whatever your medium, a four-leafed clover is a tricksy and elusive thing.)
And once I’d worked out the angles required to make a single curve work, I was able to stack them so there could be multiple arcs along the edge of each segment, like so:
I like the ones with fewer segments, so you can really see the extra arcs. The eight-segment one reminds me of a citrus fruit.
It was at this point that I noticed that all my diagrams looked quite… symmetrical. I’d pick a random starting value, and then repeat that value throughout the picture. What if I allowed even more randomness?
First I tried varying the radius of different segments. In my first version of this code, I had a bug where I didn’t join the extra-wide segments properly, leading to a rather fun “hook” effect:
After I fixed the bugs, I was able to get petals with different radii:
Then play with the angles:
It took me a couple of tries to work out how to partition 360° in a way that isn’t very lopsided – I ended up picking a random float in [0, 1] for each segment, then scaling those values up so their total was 360.
Here’s a final set of doodles, which are all “mistakes” where the code didn’t do what I was expecting, but made something pretty anyway:
There are more things I could try, like adding colour and moving the centre, but this is all I had time for. That’s okay. I was only drawing to have fun and because I wanted to make some pretty pictures, and I did both of those. I like how far I was able to get from a single idea: “what if I repeated a pattern in a circle around a central point”.